Pages That Need Review
Research Material for Speech- "The Broken Promise of 'Brown v Board of Education' ", 2004
62
Brown Speech?
Measuring the Impact of Brown v. Board
Douglas S. Reed
The key question here is, did Brown do anything? Did it really matter? If we answer yes, then the question is, what good did Brown do?
James Patterson's wonderful book neither glosses over the good things Brown did nor denies the inadequacies of the people and the institutions who sought, designed, and implemented it. I would like to spand on some of the themes that emerge from his retelling and that merit discussion beyond the framework and chronology of Brown and its progeny. The first distinction worth making is the difference between racial oppression and racial conflict, because what Brown did needs to be situated in that context. Second, there is the subject of rights consciousness: questions about whether one pursues one's rights within legal institutions or outside legal institutions, and what it means to have a right and fight for a right in courtrooms or in the street. Finally, I will look at notions of racial neutrality. This raises the issue of a color-blind Constitution and the problem of metrics; that is, how do we measure social outcomes and the impact of politics on different groups?
[Exclamation mark in the margin near the underlined line above]
First, racial oppression and racial conflict. Professor Patteron's book goes back and forth on the subject of whether the pursuit of integrated schools was the right way to puruse racial progress for African Americans in the mid twentieth century. This is the " on the one hand and on the other hand" school of historical research. On the one hand, some argue that educational quality in and of itself is sufficient. Schools for African
Douglas S. Reed is Assistant Professor of Government, Georgetown University. M.A., M. Phil., Ph.D., Yale University. Author, On Equal Terms: The Constitutional Politics of Educational Opportunity (Princeton University Press, 2001); "Not in My Schoolyard: Localism and Public Opposition to Funding Schools Equally," 82 Social Science Quarterly (March 2001); "Twenty-Five years after Rodriguez: School Finance Litigation and the Impact of the New Judicial Federalism," 32 Law and Society Review (March 1998); "The People v. The Court: School Finance Reform and the New Jersey Supreme Court," 4 Cornell Journal of Law and Public Policy (Fall 1994); "Court-Ordered School FInance Equalization: Judicial Activitism and Democratic Opposition," in William J. Fowler, ed., Developments in School Finance 1996 (National Center for Educational Statistics); and recipient of awards from the National Academy of Education, the Brookings Institution, Yale University.
BROWN V. BOARD: ITS IMPACT ON EDUCATION, AND WHAT IT LEFT UNDONE 17
88
The State of the Dream 2004: Enduring Disparities in Black and White
Income
"We called our demonstration a campaign for jobs and income because we felt that the economic question was the most crucial that black people, and poor people generally, were confronting."
--Dr. Martin Luther King, Jr. Look Magazine, 1968
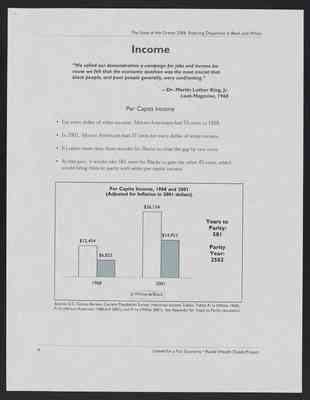
Per Capita Income
• For every dollar of white income, African-Americans had 55 cents in 1968.
• In 2001, African-Americans had 57 cents for every dollar of white income.
• It's taken more than three decades for Blacks to close the gap by two cents.
• At this pace, it would take 581 years for Blacks to gain the other 43 cents, which would bring them to parity with white per capita income.
[image:] Graph with the following text: Per Capita Income, 1968 and 2001 (Adjusted for Inflation in 2001 dollars) 1968 White $12,454 1968 Black $6,823 2001 White $26,134 2001 Black $14,953 Years to Parity: 581 Parity Year: 2582
Source: U.S. Census Bureau, Current Population Survey, Historical Income Tables, Tables P-1a (White 1968), P-1b (African-American 1968 and 2001), and P-1e (White 2001). See Appendix for Years to Parity calculation.
---------------------------------------------------------------------------------
6 United for a Fair Economy • Racial Wealth Divide Project
107
The State of the Dream 2004: Enduring Disparities in Black and White
Appendix
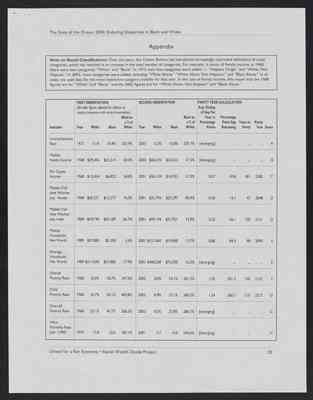
Note on Racial Classifications: Over the years, the Census Bureau has introduced increasingly restrictive definitions of racial categories, which has resulted in an increase in the total number of categories. For example, in terms of Family income, in 1968, there were two categories: "White" and "Black." In 1972, two new categories were added -- "Hispanic Origin" and "White, Not Hispanic." In 2002, more categories were added, including "White Alone;" "White Alone, Not Hispanic;" and "Black Alone." In all cases, we used data for the most restrictive category available for that year. In the case of Family income, this means that the 1968 figures are for "White" and "Black," and the 2002 figures are for "White Alone, Not Hispanic" and "Black Alone."
FIRST OBSERVATION (All dollar figures adjusted for inflation to enable comparison with second observation.)
| Indicator | Year | White | Black | Black as a % of White |
|---|---|---|---|---|
| Unemployment Rate | 1972 | 5.1% | 10.4 | 203.9% |
| Median Family Income | 1968 | $39,206 | $23,514 | 60.0% |
| Per Capita Income | 1968 | $12,454 | $6,823 | 54.8% |
| Median Full-time Worker pay, female | 1968 | $20,231 | $15,377 | 76.0% |
| Median Full-time Worker pay, male | 1968 | $34,749 | $23,189 | 66.7% |
| Median Household Net Worth | 1989 | $97,800 | $5,300 | 5.4% |
| Average Household Net Worth | 1989 | $317,600 | $57,000 | 17.9% |
| Overall Poverty Rate | 1968 | 10.0% | 34.7% | 347.0% |
| Child Poverty Rate | 1968 | 10.7% | 43.1% | 402.8% |
| Over-65 Poverty Rate | 1968 | 23.1% | 47.7% | 206.5% |
| Infant Mortality Rate (per 1,000) | 1970 | 17.8 | 32.6 | 183.1% |
| Indicator | Year | White | Black | Black as a % of White |
|---|---|---|---|---|
| Unemployment Rate | 2003 | 5.2% | 10.8 | 207.7% |
| Median Family Income | 2002 | $58,270 | $33,525 | 57.5% |
| Per Capita Income | 2001 | $26,134 | $14,953 | 57.2% |
| Median Full-time Worker pay, female | 2001 | $31,794 | $27,297 | 85.9% |
| Median Full-time Worker pay, male | 2001 | $43,194 | $31,921 | 73.9% |
| Median Household Net Worth | 2001 | $121,000 | $19,000 | 15.7% |
| Average Household Net Worth | 2001 | $468,200 | $75,700 | 16.2% |
| Overall Poverty Rate | 2002 | 8.0% | 24.1% | 301.3% |
| Child Poverty Rate | 2002 | 8.9% | 32.1% | 360.7% |
| Over-65 Poverty Rate | 2002 | 8.3% | 23.8% | 286.7% |
| Infant Mortality Rate (per 1,000) | 2001 | 5.7 | 14.0 | 245.6% |
| Indicator | Avg. Closing of Gap Per Year, in Percentage Points | Percentage Point Gap Remaining | Years to Parity | Parity Year | Source |
|---|---|---|---|---|---|
| Unemployment Rate | [diverging] | - | - | - | A |
| Median Family Income | [diverging] | - | - | - | B |
| Per Capita Income | 0.07 | 42.8 | 581 | 2582 | C |
| Median Full-time Worker pay, female | 0.30 | 14.1 | 47 | 2048 | D |
| Median Full-time Worker pay, male | 0.22 | 26.1 | 120 | 2121 | D |
| Median Household Net Worth | 0.86 | 84.3 | 98 | 2099 | E |
| Average Household Net Worth | [diverging] | - | - | - | E |
| Overall Poverty Rate | 1.35 | 201.3 | 150 | 2152 | F |
| Child Poverty Rate | 1.24 | 260.7 | 210 | 2212 | G |
| Over-65 Poverty Rate | [diverging] | - | - | - | G |
| Infant Mortality Rate (per 1,000) | - | - | - | G |
108
The State of the Dream 2004: Enduring Disparities in Black and White
Appendix, continued
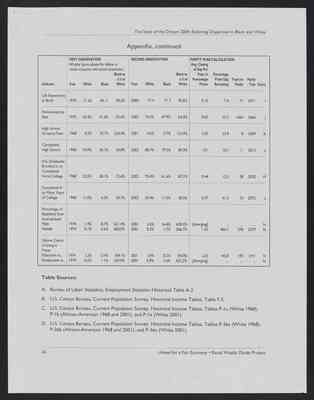
FIRST OBSERVATION (All dollar figures adjusted for inflation to enable comparison with second observation.)
| Indicator | Year | White | Black | Black as a % of White |
|---|---|---|---|---|
| Life Expectanty at Birth | 1970 | 71.62 | 64.11 | 89.5% |
| Homeownership Rate | 1970 | 65.4% | 41.6% | 63.6% |
| High School Dropout Rate | 1968 | 4.5% | 41.6% | 63.6% |
| Completed High School | 1968 | 54.9% | 30.1% | 54.8% |
| H.S. Graduates Enrolled in or Completed Some College | 1968 | 52.5% | 38.1% | 72.6% |
| Completed 4 or More Years of College | 1968 | 11.0% | 4.3% | 39.1% |
| Percentage of Residents Ever Incarcerated: Male | 1974 | 1.4% | 8.7% | 621.4% |
| Percentage of Residents Ever Incarcerated: Female | 1974 | 0.1% | 0.6% | 600.0% |
| Lifetime Chance of Going to Prison: Males born in | 1974 | 2.2% | 13.4% | 609.1% |
| Lifetime Chance of Going to Prison: Females born in | 1974 | 0.2% | 1.1% | 550.0% |
| Indicator | Year | White | Black | Black as a % of White |
|---|---|---|---|---|
| Life Expectanty at Birth | 2000 | 77.4 | 71.7 | 92.6% |
| Homeownership Rate | 2002 | 74.5% | 47.9% | 64.3% |
| High School Dropout Rate | 2001 | 4.6% | 5.7% | 123.9% |
| Completed High School | 2002 | 88.7% | 79.2% | 89.3% |
| H.S. Graduates Enrolled in or Completed Some College | 2002 | 70.4% | 61.6% | 87.5% |
| Completed 4 or More Years of College | 2002 | 29.4% | 17.2% | 58.5% |
| Percentage of Residents Ever Incarcerated: Male | 2001 | 2.6% | 16.6% | 638.5% |
| Percentage of Residents Ever Incarcerated: Female | 2001 | 0.3% | 1.7% | 566.7% |
| Lifetime Chance of Going to Prison: Males born in | 2001 | 5.9% | 32.2% | 545.8% |
| Lifetime Chance of Going to Prison: Females born in | 2001 | 0.9% | 5.6% | 622.2% |
| Indicator | Avg. Closing of Gap Per Year, in Percentage Points | Percentage Point Gap Remaining | Years to Parity | Parity Year | Source |
|---|---|---|---|---|---|
| Life Expectanty at Birth | 0.10 | 7.4 | 71 | 2071 | I |
| Homeownership Rate | 0.02 | 35.7 | 1664 | 3666 | J |
| High School Dropout Rate | 3.05 | 23.9 | 8 | 2009 | K |
| Completed High School | 1.01 | 10.7 | 11 | 2013 | L |
| H.S. Graduates Enrolled in or Completed Some College | 0.44 | 12.5 | 28 | 2030 | M |
| Completed 4 or More Years of College | 0.57 | 41.5 | 73 | 2075 | L |
| Percentage of Residents Ever Incarcerated: Male | [diverging] | - | - | - | N |
| Percentage of Residents Ever Incarcerated: Female | 1.23 | 466.7 | 378 | 2379 | N |
| Lifetime Chance of Going to Prison: Males born in | 2.35 | 445.8 | 190 | 2919 | N |
| Lifetime Chance of Going to Prison: Females born in | [diverging] | - | - | - | N |
A. Bureau of Labor Statistics, Employment Situation Historical Table A-2.
B. U.S. Census Bureau, Current Population Survey, Historical Income Tables, Table F-5.
C. U.S. Census Bureau, Current Population Survey, Historical Income Tables, Tables P-1a (White 1968), P-1b (African-American 1968 and 2001), and P-1e (White 2001).
D. U.S. Census Bureau, Current Population Survey, Historical Income Tables, Tables P-36a (White 1968), P-36b (African-American 1968 and 2001), and P-36e (White 2001).
26 United for a Fair Economy * Racial Weath Divide Project